The HR diagram for main sequence stars
Two astronomers on different sides of the Atlantic had the same idea, that there should be a correlation between a star's temperature and its luminosity.
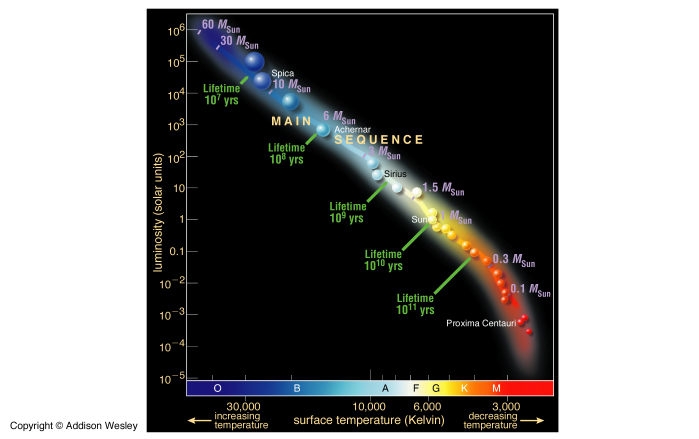
In 1905 Ejnar Hertzsprung published a table that confirmed this relationship. And then in 1913 Henry Norris Russell published a diagram that expressed the same idea. A jazzed up version of this very old kind of plot is shown below. It is now called the Hertzsprung-Russell (H-R) diagram in honor of the two astronomers who first conceived it.
The HR diagram for main sequence stars
The first time this diagram was made allowed the definition of the main sequence.
This is the sequence of stars that have their luminosity well-correlated with their surface temperature. It was later discovered that these are stars that are stably fusing the hydrogen in their cores to sustain themselves.